5 Tools to Identify ASP.NET Performance Issues
Next to security, performance should be your top priority. Today, we'll cover five tools to identify performance issues in your ASP.NET website.

When building a website, most developers want the site up and running as fast as possible.
This approach is great for shipping a product quickly. Yet, there is one factor every developer should consider before launching: performance.
Web performance is one of those topics requiring a certain amount of art and science to spot issues. These skills almost equate to a technical forensic examining a crime scene for the first time.
Although, waiting for a web page to display where a white screen resides is now common on most websites.
So how do you optimize the website?
While I wrote numerous ways to improve performance in ASP.NET websites (ref: 1, 2, 3), I've never explained the tools I've used to find server-side performance issues.
In today's post, we examine five tools to find performance issues or bottlenecks in your ASP.NET websites.
Keep in mind, these tools are server-side and pertain to optimizing C# as opposed to client-side optimizations.
1. Visual Studio 201x Profiling Tools

Out of the box, Visual Studio 2019 Enterprise provides great profiling tools to find bottlenecks and slow running processes.
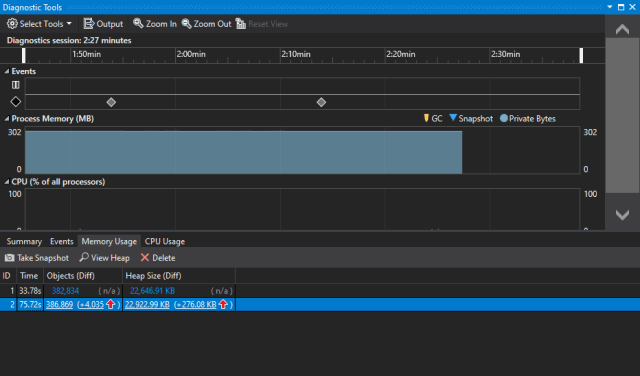
One such tool is the Diagnostics Tools window under the Debug -> Windows -> Show Diagnostic Tools (or Ctrl-Alt-F2).
This view is great for presenting an overview of all resources used by your website.
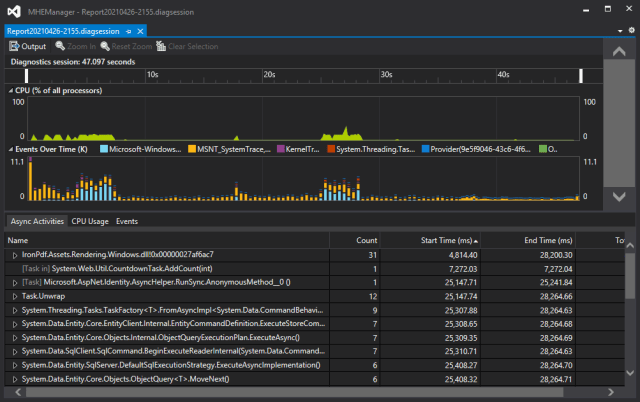
However, if you want to dig further, I would recommend using the Performance Profiler (Alt-F2).

This tool builds a visual representation of async/await activities, CPU Usage, and Events. Since we are profiling websites, it doesn't make sense to run GPU Profiling. It's even recommended by Microsoft not to use it for websites.
I've examined events in both tools and realized I had some interesting issues regarding LINQ queries and Entity Framework.
Once I understood what's happening behind the scenes, I knew what areas to focus on in my code.
Reference:
2. Middleware Checks
While this next one isn't specifically a tool, it's a technique on how to spot slowdowns in your middleware.
One of the latest features of ASP.NET Core/.NET 5 is the concept of Middleware. If you've integrated a feature in Middleware, how can you optimize it?
Luckily, the ASP.NET Core team has ways to profile or gauge how fast each middleware piece takes (in bold).
app.Use(next => async context =>
{
    var sw = Stopwatch.StartNew();
    await next(context);
    sw.Stop();

    logger.LogInformation("UseRouting() Time: {ElapsedMilliseconds}ms", sw.ElapsedMilliseconds);
});

app.UseRouting();

app.Use(next => async context =>
{
    var sw = Stopwatch.StartNew();
    await next(context);
    sw.Stop();

    logger.LogInformation("UseAuthentication() Time: {ElapsedMilliseconds}ms", sw.ElapsedMilliseconds);
});

app.UseAuthentication();

app.Use(next => async context =>
{
    var sw = Stopwatch.StartNew();
    await next(context);
    sw.Stop();

    logger.LogInformation("UseAuthorization() Time: {ElapsedMilliseconds}ms", sw.ElapsedMilliseconds);
});

app.UseAuthorization();
Select code in bold from above to each service you want to profile to find the culprit of which Middleware piece takes the most time.
3. Benchmark.NET (open-source)

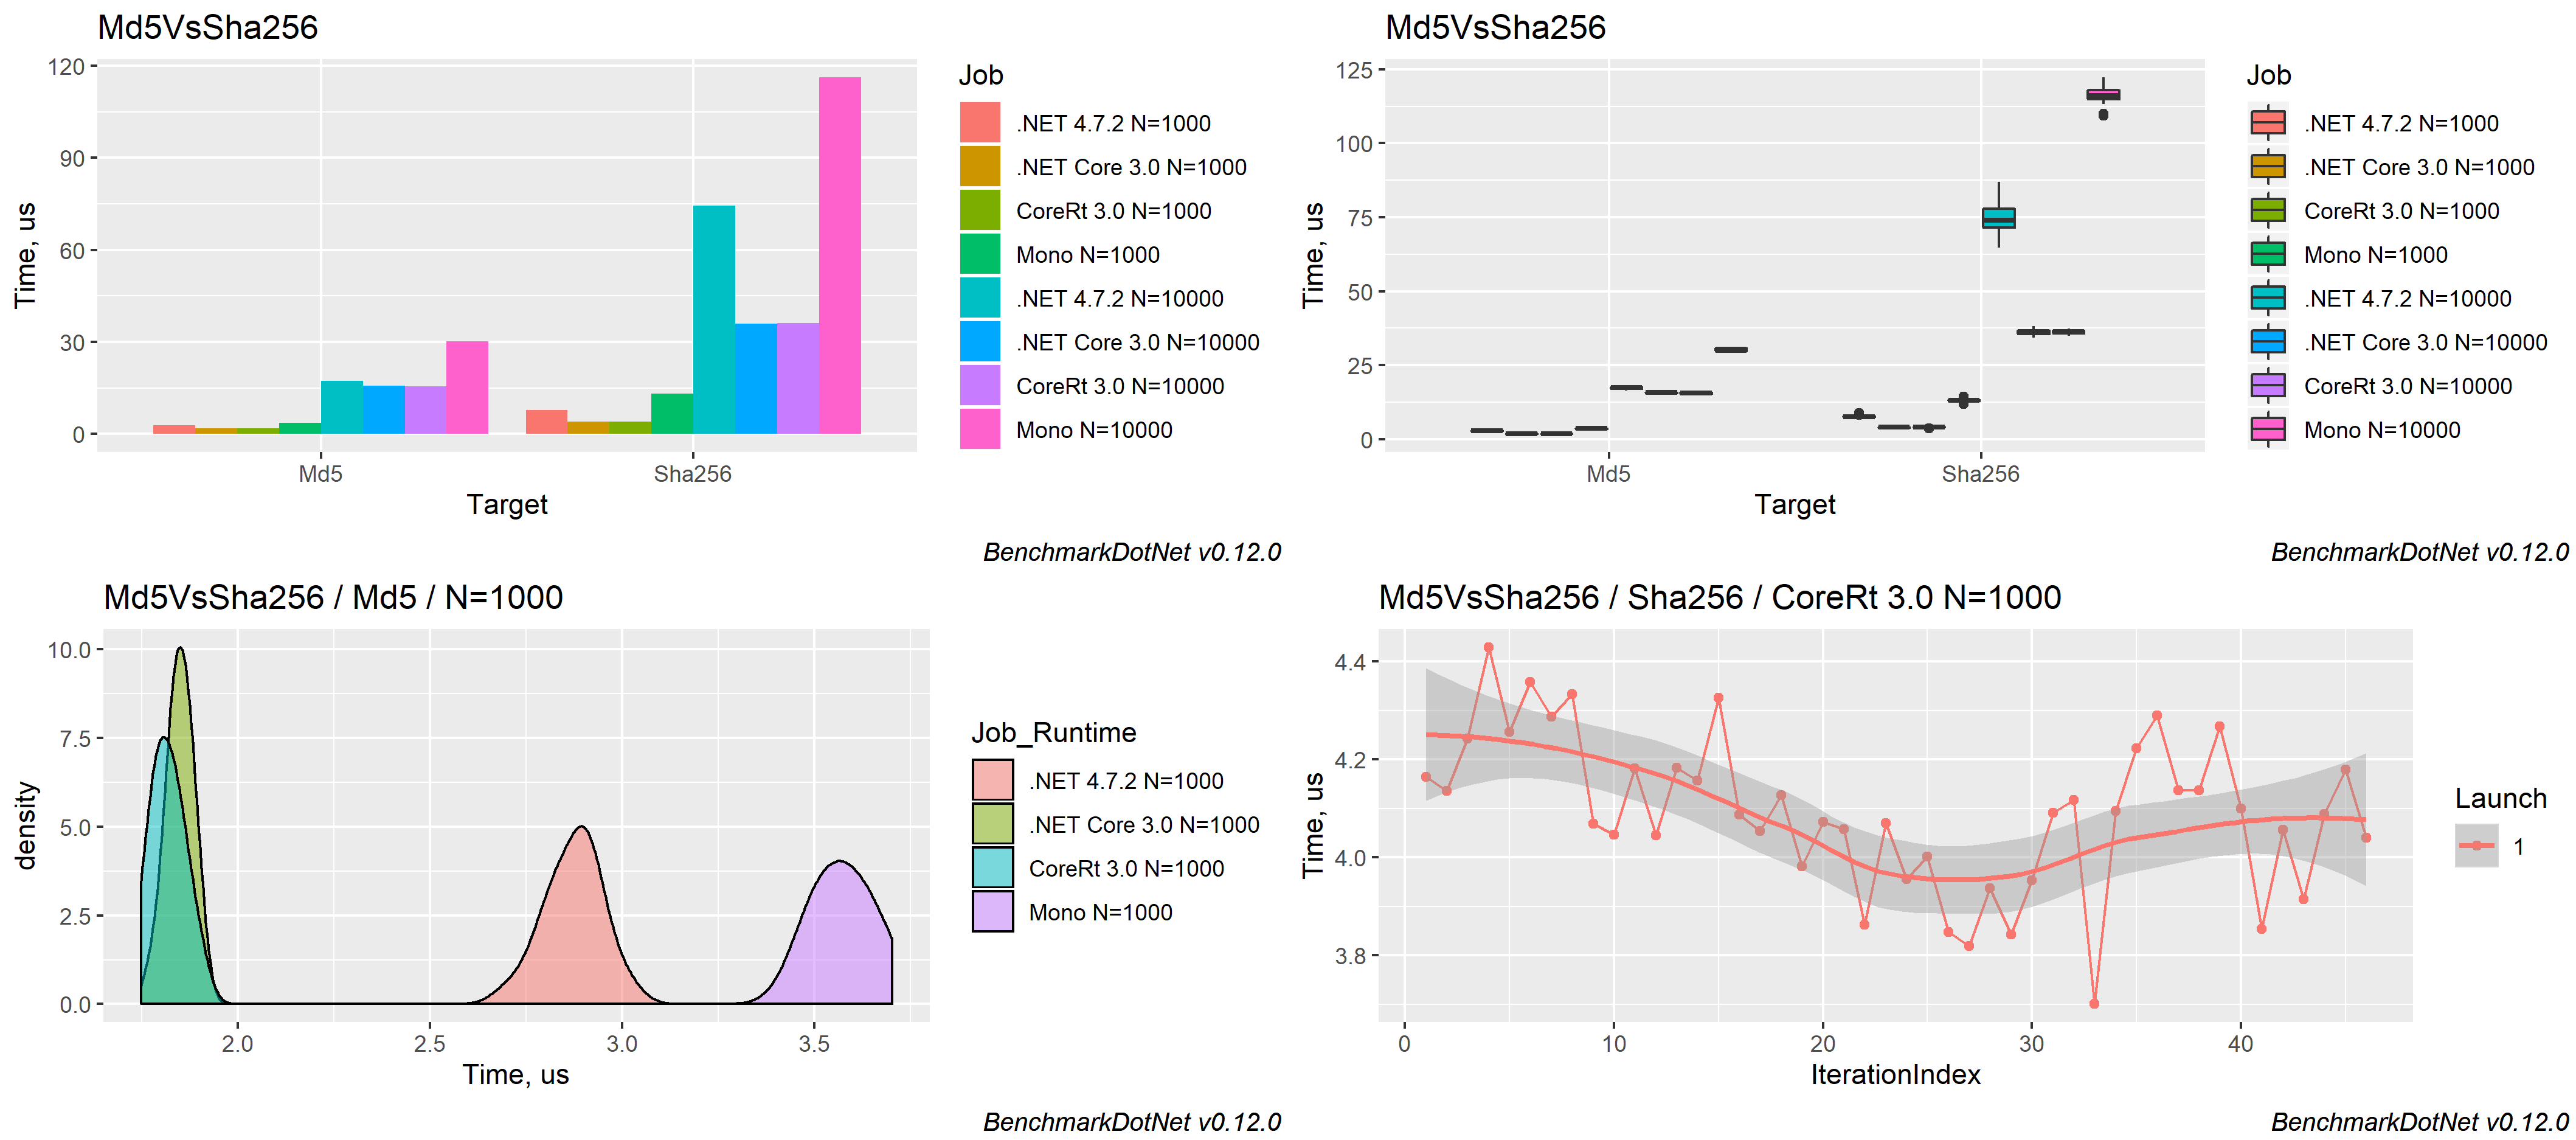
Benchmark.NET has been around for a while (5 years) and gives developers a way to track their code's performance through each method and their calls.
It's easy to set up and is used by a large number of projects already including ASP.NET Core, Entity Framework Core, and SignalR just to name a few.
There is even an APress book on it called Pro .NET Benchmarking.
4. dotTrace (JetBrains)
JetBrains has always been synonymous with .NET developers mainly because of Resharper. Their additional tools (dotMemory, dotPeek, dotCover) provide a full suite meant to optimize your applications, but for now, we'll focus on dotTrace.
This is my tool of choice for optimizing code.
It shows hot spots, drill-down features, filters on "system code" vs. "your code," and pinpoints the source code related to the slowdown.
For example, I was wondering why an ASP.NET MVC project took so long to load a particular page. After initially running the website, the page would take a while to load and then it would become snappier after subsequent visits (I know, I know...caching).
After running dotTrace, I found out it was the JavaScript bundler at runtime. The issue was a large number of JavaScript files dynamically bundled at run-time. It took a while to bundle and return them to the browser.
One of the recommendations I made was to use a Task Runner to bundle the JavaScript at design-time and reference the generated JavaScript file. This would create the bundle during compile-time and result in a single JavaScript file for the browser.
Overall, this is the tool I would recommend for optimizing C# code.
5. ANTS Performance Profiler (Red Gate)
While I haven't used the ANTS Performance Profiler, I've heard other .NET developers say it's a fantastic profiler and digs into the hard-to-reach spaces of .NET to find performance bottlenecks.
This is another great tool which I've never had the pleasure of using on my .NET projects.
It is Red Gate and I do like their tools so if you want a top-tier performance profiler and have the ability to get it, I would also recommend ANTS.
Conclusion
All of these tools identify pain points where code isn't optimized or produces slow results.
While in some cases, waiting for a page to load can make a developer go "Ahhh!" and know exactly where to go in the code to fix the issue.
Yet, if you struggle to find the performance issue, it may be quicker to use one of these tools and save yourself a lot of time in the long run.
Did I miss a particular optimization tool? What do you use to improve performance? Post your comments below and let's discuss.


