Review: NDepend for Visual Studio
NDepend takes code analysis to a whole new level. In this review, I cover the benefits of owning this must-have tool.
Once you start developing with C#, you become more experienced with writing great code and look to productivity tools to write faster code using tools like JustCode, ReSharper, or CodeRush.
After that progression, you need to analyze your code to make sure you aren't duplicating any code, writing true object-oriented algorithms, and writing small pockets of code in short methods.
I haven't seen too many static code analyzers out there. One of my friends mentioned SonarQube to me, which I'll touch on later in the review, but I've never really had a real hands-on amount of time to truly evaluate these static code analyzers.
Today, I provide an in-depth analysis of the static code analyzer called NDepend.
Overview
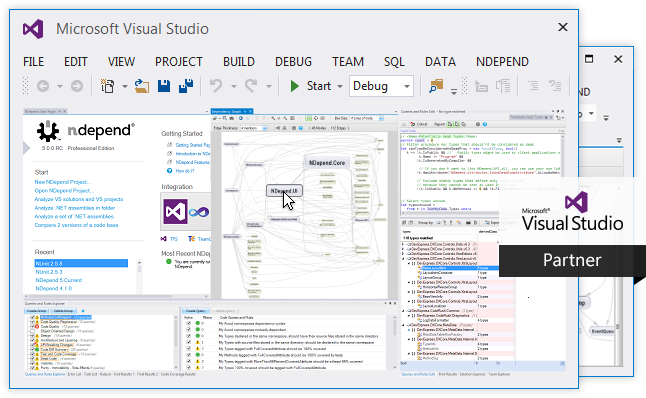
NDepend is a static code analyzer extension for Visual Studio 2010, 2012, 2013, and 2015. It's used for analyzing your compiled code and showing statistics and patterns to improve your code base.
If you are thinking to yourself, "why do I need NDepend when I have Resharper?" That's a great question! My response is that ReSharper is strictly meant for focusing on the code at hand. It offers suggestions as you write code and move units around folders and offer suggestions at a micro level.
NDepend looks at the solution as a whole, or on a macro level, and makes suggestions based on the code presented at the time of analysis. NDepend also wrote a great blog post about NDepend vs ReSharper. I would definitely check it out!
Installation
I received a zip file through email (not an installation .exe, but a zip file) and I extracted the contents out to a folder.
Along with the Visual Studio Extension, there was also a VisualNDepend.exe available in case you didn't want to run the full-blown Visual Studio just to analyze a solution. We know how long it takes to load Visual Studio, don't we?

I was instructed to run the Visual Studio Extension Installer (NDpend.VisualStudioExtension.Installer.exe).
Once installed, a NDependProLicense.xml file was required to be available in the directory of my extracted files. This process was a little bit clunky and could've been fine-tuned and streamlined a little better.
I ran Visual Studio 2015 and loaded one of my sample projects (My WebGrid example).
First Impressions
Once I loaded my WebGrid example, I noticed a new NDepend menu item. It seems you have two choices when using NDepend. You can "Attach a new NDepend project to the current project" or you can "Attach an existing NDepend project to the current project."
Since this is the first time I ran NDepend, I chose the former (Attach a new NDepend project to a current project).
This new dialog is what I consider to be the equivalent of the "New Project" in Visual Studio, but only customized for code analytics.
This is the difference between Resharper and NDepend. It can include a number of assemblies when analyzing a solution and can immediately build a report after building the project.
Once you click analyze, it compiles your project, analyzes the code, and, if you had the checkbox clicked to "Build a report," it would write a report out to the browser.
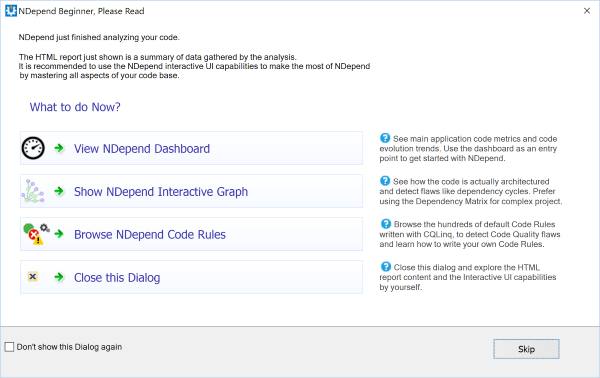
After your report is built, you have the following options. You can go to:
- The NDepend Dashboard (recommended)
- Show the NDepend Interactive Graph
- Browser NDepend Code Rules
- Close this Dialog
Simple enough, right?
I decided to head over to the dashboard.
Wow!
I was absolutely blown away by the amount of analytics produced by this tool.
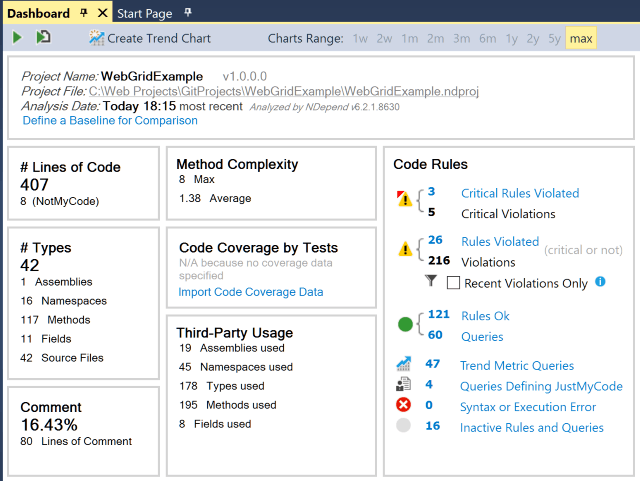
While I never thought this was possible, NDepend generates a dashbord for your project's code.
Below is an example of my WebGrid project.
Let's explore the tool some more.
NDepend's Analysis Tools
The first set of analysis tools I started using was the Rules Explorer Panel and the Rule Edition Panel.
NDepend's Rules Explorer Panel
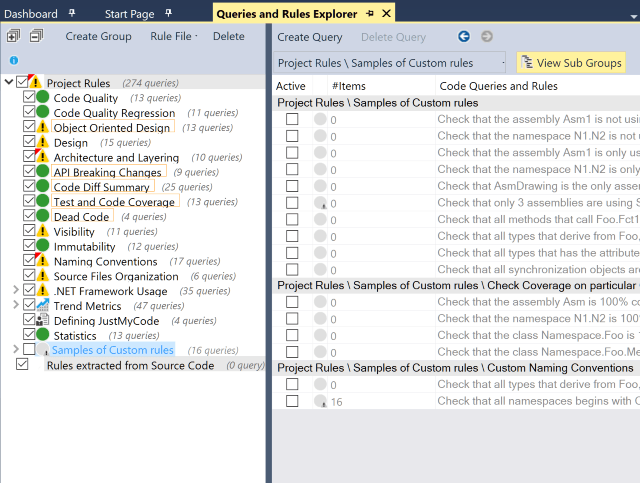
You'll find yourself coming back to these two panels again and again as you continue to analyze your code.
While I was fascinated with the Rules Explorer on the left, I didn't realize the complexity available on the right with the Rule Edition Panel.
NDepend's Rule Edition Panel
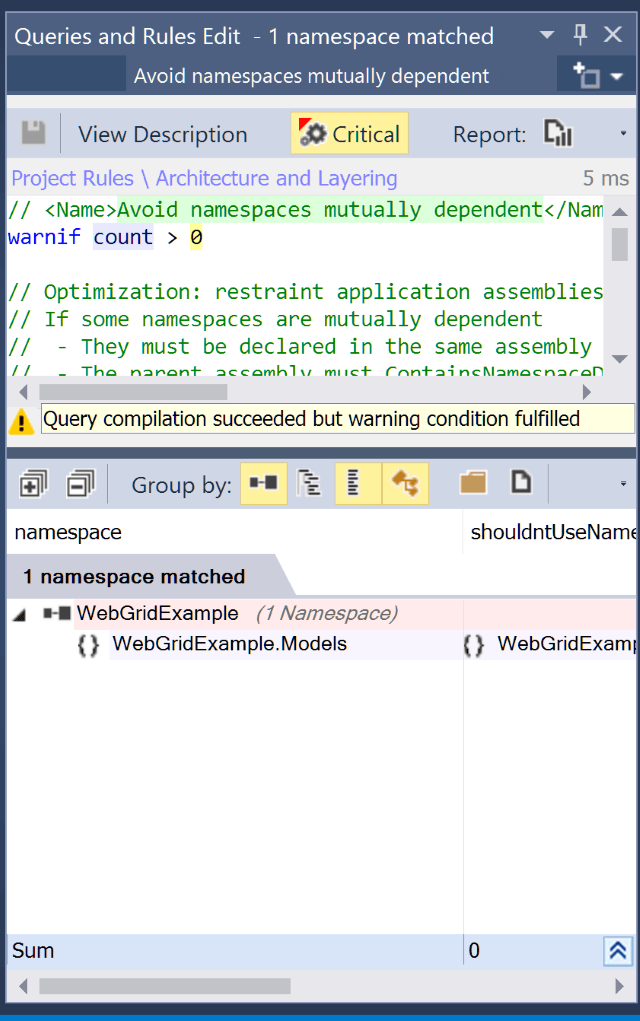
Inside this panel is what I consider the hidden jewel of NDepend's robustness.
The developers of NDepend wrote what I consider to be a LINQ language for Applications.
They call it Code Query for LINQ (CQLINQ).
It uses Code Completion with IntelliSense, quick compiling feedback, and integrated tooltip documentation...for your code.
A query language to examine your code.
<mind blown>
Once you create your CQLINQ statement, you can immediately run it against your code to see the results to fine-tune your code even further.
The amount of code analysis is absolutely limitless as to what you can dream up to make your project's code have exceptional standards.
With almost 200 existing code metrics already available, you can extend it further with the CQLINQ syntax to expand the library even further.
The CQLINQ language along with the Rule Explorer Panel and Edition Panel alone is worth the price of this product.
Dependencies Graph
As your application continues to grow, you may be unaware of a number of dependencies your application accumulates over time.
The dependencies graph provides an at-a-glance view of dependencies in your project.
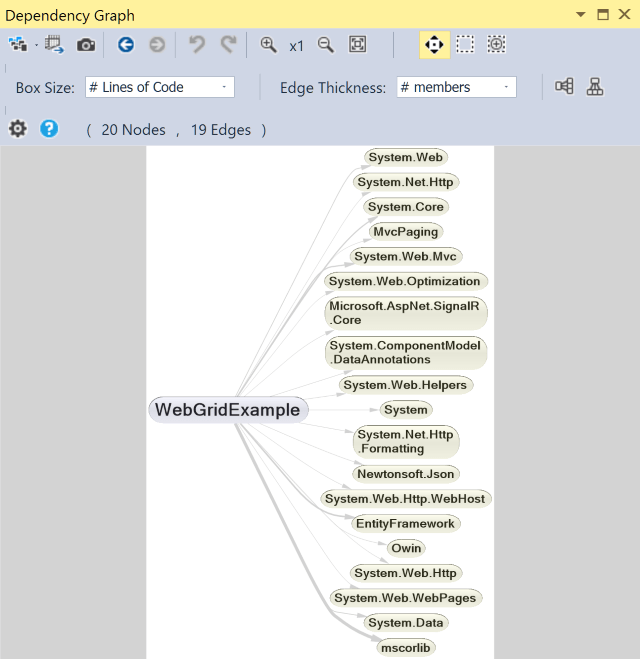
As you can see, my WebGrid example doesn't use anything additional except the .NET framework along with some smaller libraries (EF, SignalR, etc.).
While this gives you a great overview of dependencies required for your application to run, if you hover over a particular dependency, you will see the callers (and callees) of the assemblies.
Right-click on a node to drill down even further to understand the relationship of the dependency.
Dependency Matrix
The dependency matrix is a unique view of your code diving deeper to analyze dependencies on a namespace by namespace level, even further.
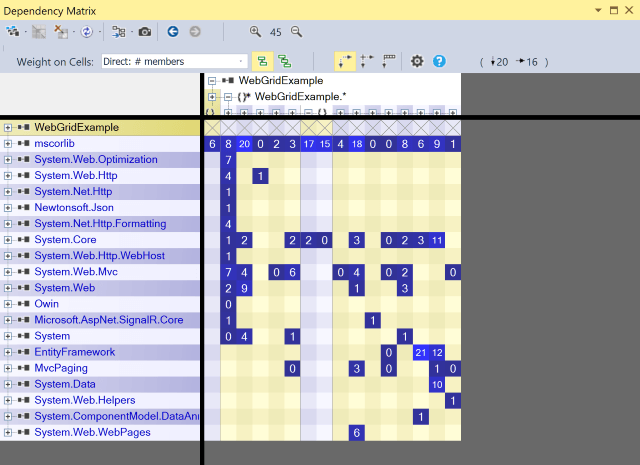
The whole idea is to identify when dependencies in a square turn black, it means that a number of namespaces are using n number of namespaces indirectly.
There are a ton of ways to splice this data making it easier to identify susceptible code requiring a refactor later.
Diff Tool
Once you are writing code, you want to make baselines of your code every day so you can analyze the differences. The Diff tool is great for comparing different code bases.
The menu items are broken down into the following categories:
- Code Diff Summary (with 25 difference metrics)
- API Breaking Changes (w/ 10 difference metrics)
- Code Quality Regression (w/ 11 difference metrics)
Once selecting a difference metric, it'll display the Rules Edition Panel with the results of the difference metrics selected.
These metrics provide great insight into the differences from day to day (and who to tap on the shoulder).
Trend Charts
Trending charts are strictly for the dashboard and provide a great view to see what's occurring with your code over time.
If major refactoring occurs, there is a chance that the LoC (lines of code) trend chart will start to drop.
To effectively use this chart, you need a baseline for your code. Every time you run a report, your Trending Charts will update and provide you with up-to-the-minute results with what your code is doing over time.
In a team environment, this tool is invaluable. You'll be able to see how much code was refactored or rewritten to provide better (or worse) code goals and possibly how many rules were violated when implementing new code.
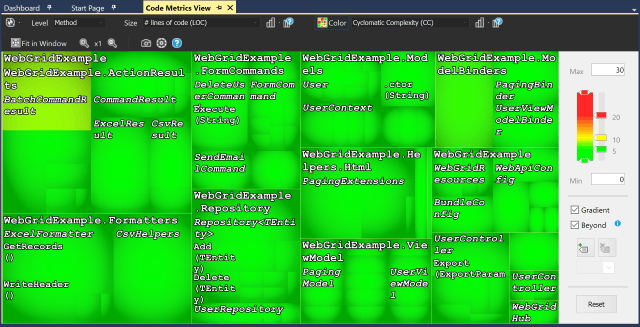
Code Metrics View
The code metrics view took me a while to get used to.
The LOC selection at a method level made me realize that you can adjust the level on the right side to say "Give me a visual representation of methods (by level in the top left) that have more than 5 lines of code."
A color representation will be generated based on that criteria identifying the methods that are the culprit.
The one thing I wrestled with in this view was the font. I went to the options and noticed that you couldn't control the font type or size for this screen. You can see how busy it can get with long namespaces, but I like the idea of analyzing the project as an overall code monitoring tool.
Integration
One of my coworkers mentioned we were thinking about getting SonarQube for analyzing code on the server when checked in or for a particular build time during the day. The great news is that NDepend integrates right into SonarQube with no problem.
My coworker looked at NDepend and said, "if this is within reason, we should use this along with SonarQube." He thought the product was leaps and bounds ahead of SonarQube providing more detailed reports with the ability to drill down to code further than SonarQube would.
Other products that NDepend integrates with is TFS, CruiseControl.net, FinalBuilder, and TeamCity.
While there is even a build version of NDepend available, I didn't get a chance to test it to provide a full review of the server version.
Some Observations
A couple of things I noticed about NDepend was my use of Entity Framework. Almost every project I write lately includes Entity Framework. All of my entities in my project had public properties.
NDepend recommended I make my public properties private or protected. We all know that most ORMs require a visibility of public to save it's data to the persistent storage. Once I changed the scope of the variables to private, my saving stopped working.
Another observation was my unit tests. NDepend reported that I got dinged for having very long method names. Uh-huh. They kind of go with the territory. Long unit test names to describe the unit test...and I got dinged on it.
While I believe this tool has an absolute place in my toolkit, I take the rules that I violated with a grain of salt.
I know there are some developers out there who believe that a tool would never lie to them and they HAVE to abide by its rules or you aren't a developer.
Not true.
These violated rules are merely guidelines to make you a better developer. You can enable and disable certain rules based on your code requirements. Just don't become a code nazi! ;-)
Another thing I noticed is that video assistance is available in the most expected locations in the application. A welcome feature for those not knowing how to read a particular view or know how to use NDepend correctly.
Conclusion
After using NDepend for two weeks, I can truly say that the views I'm using the most are the Dashboard, Rules Explorer Panel and Edition Panel, Diff Tool, and Code Metrics View.
NDepend is definitely not for the newbie software developer. Some developers may not even know where to start with this particular tool.
But let me just say that the amount of expertise that went into this product is absolutely staggering.
NDepend is meant for veteran software developers, software architects, and senior leads. It provides a 50,000-foot view of what the structure of a project's codebase looks like.
These kinds of tools like NDepend are required for teams dealing with proper code reviews, examining code when code is idle (like on weekends), or when you have a possible circular reference in play.
NDepend not only has a great static code analysis tool, but also provides a way for veteran developers and aspiring architects alike to adhere to coding standards along with a way to integrate a company's coding standards into the tool using CQLINQ.
This is definitely a tool for advanced developers and one that I definitely recommend to anyone looking to analyze a code base.
Did anyone else purchase this awesome tool? Post your comments below.
NDepend for Visual Studio
- http://www.ndepend.com/
- Cost: $328 (single developer); $659 (Build Machine Edition); Price Guide
Summary
NDepend not only has a great static code analysis tool, but also provides a way for veteran developers and aspiring architects alike to adhere to coding standards along with a way to integrate a company's coding standards into the tool using CQLINQ. This is definitely a tool for advanced developers and one that I definitely recommend to anyone looking to analyze a code base.
Good
- Excellent Summarized Code Views
- Videos sprinkled throughout to assist
- Customizable using CQLINQ
Bad
- Manual installation
- Some Views require customization (fonts)
- All rules don't apply to some code
